Preview & Debugging
The Preview perspective runs your study against the same runtime participants will use — no publishing required. It's how you confirm trial logic, timing, and bindings actually work, and it's your main debugging tool.
Choose a scenario
Preview can drive the study with a simulated participant so you don't have to play through it by hand. Pick a Scenario in the left navigator:
- Random participant — responds plausibly at random.
- Perfect responder — always gives the correct response.
- Timeout responder — never responds (exercises your timeout handling).
- Custom scenario — define your own behavior.
Toggle Participant vs Debug mode, and pick a Display size (Desktop / Laptop / Tablet / Mobile) to preview different viewports.
Run it
- Start the preview
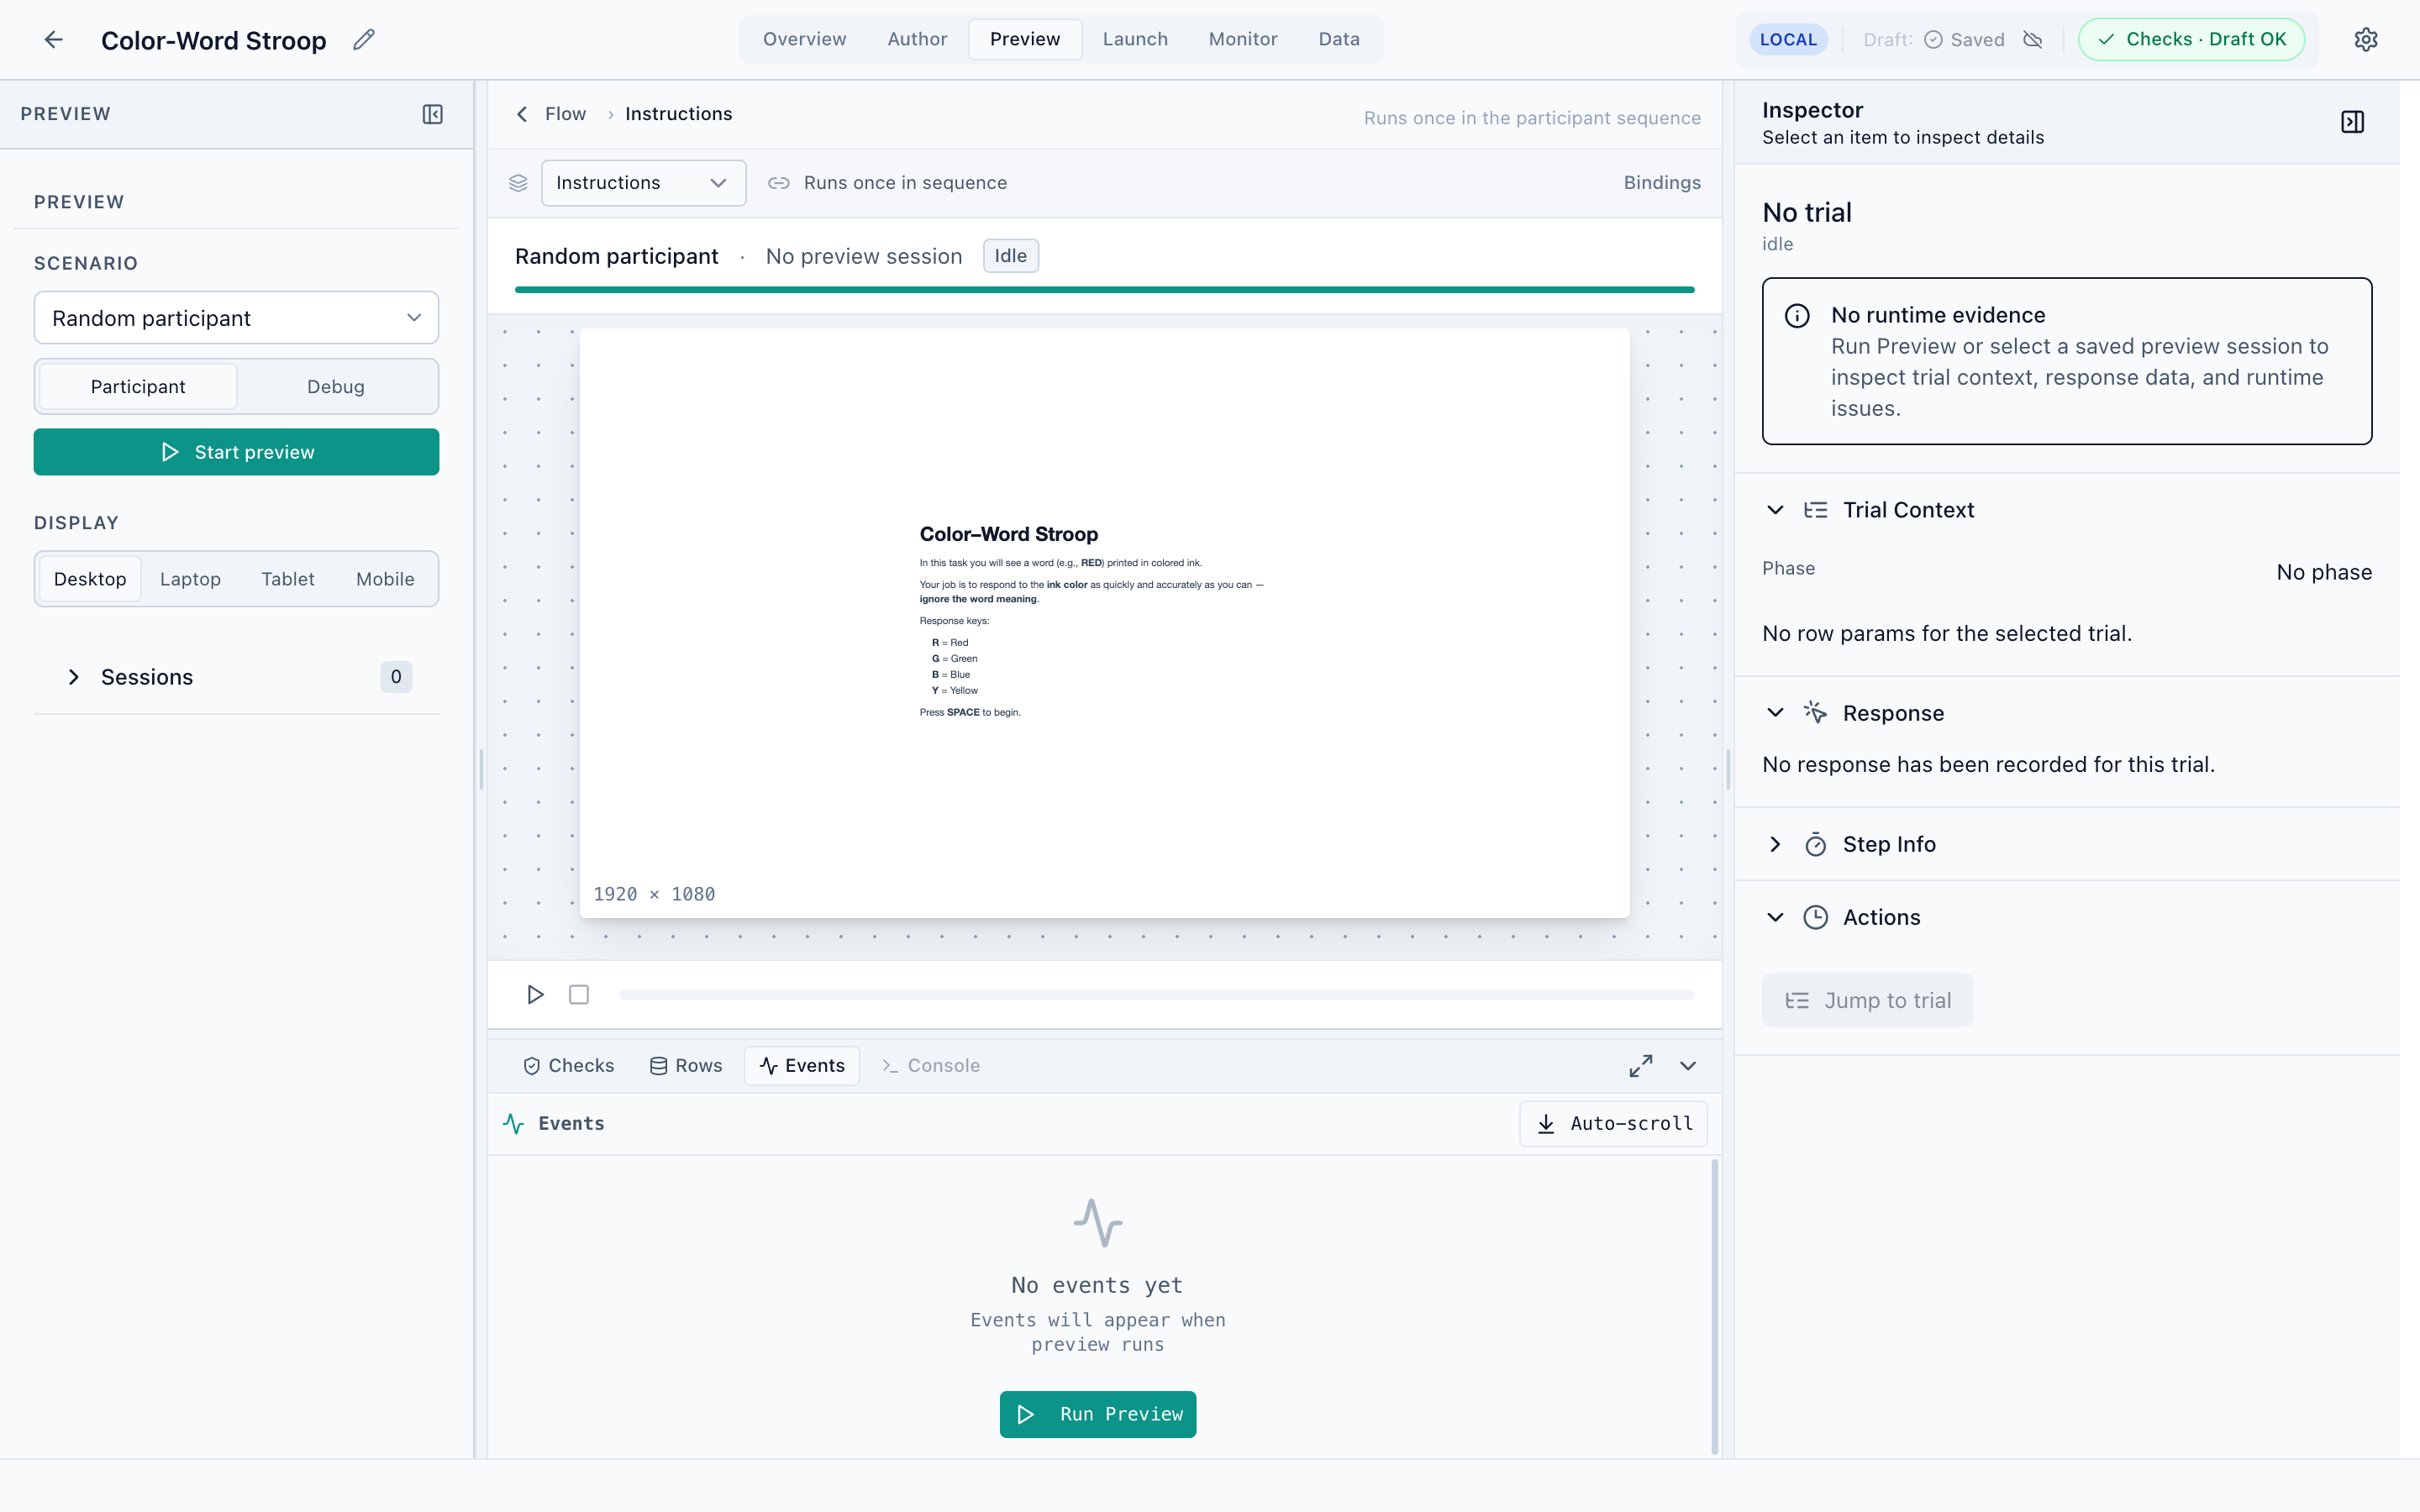
Click Start preview. The runtime plays from the first phase — for the Stroop study it opens on the instructions screen, then runs trials according to the chosen scenario.
- Watch the events stream
The Events dock fills with the runtime telemetry — trial starts, responses, checkpoints, block and experiment boundaries — each with a timestamp.
- Inspect any trial
The Inspector shows the live Trial Context for the current trial: its phase, row index, resolved row parameters, the recorded response, and reaction time.
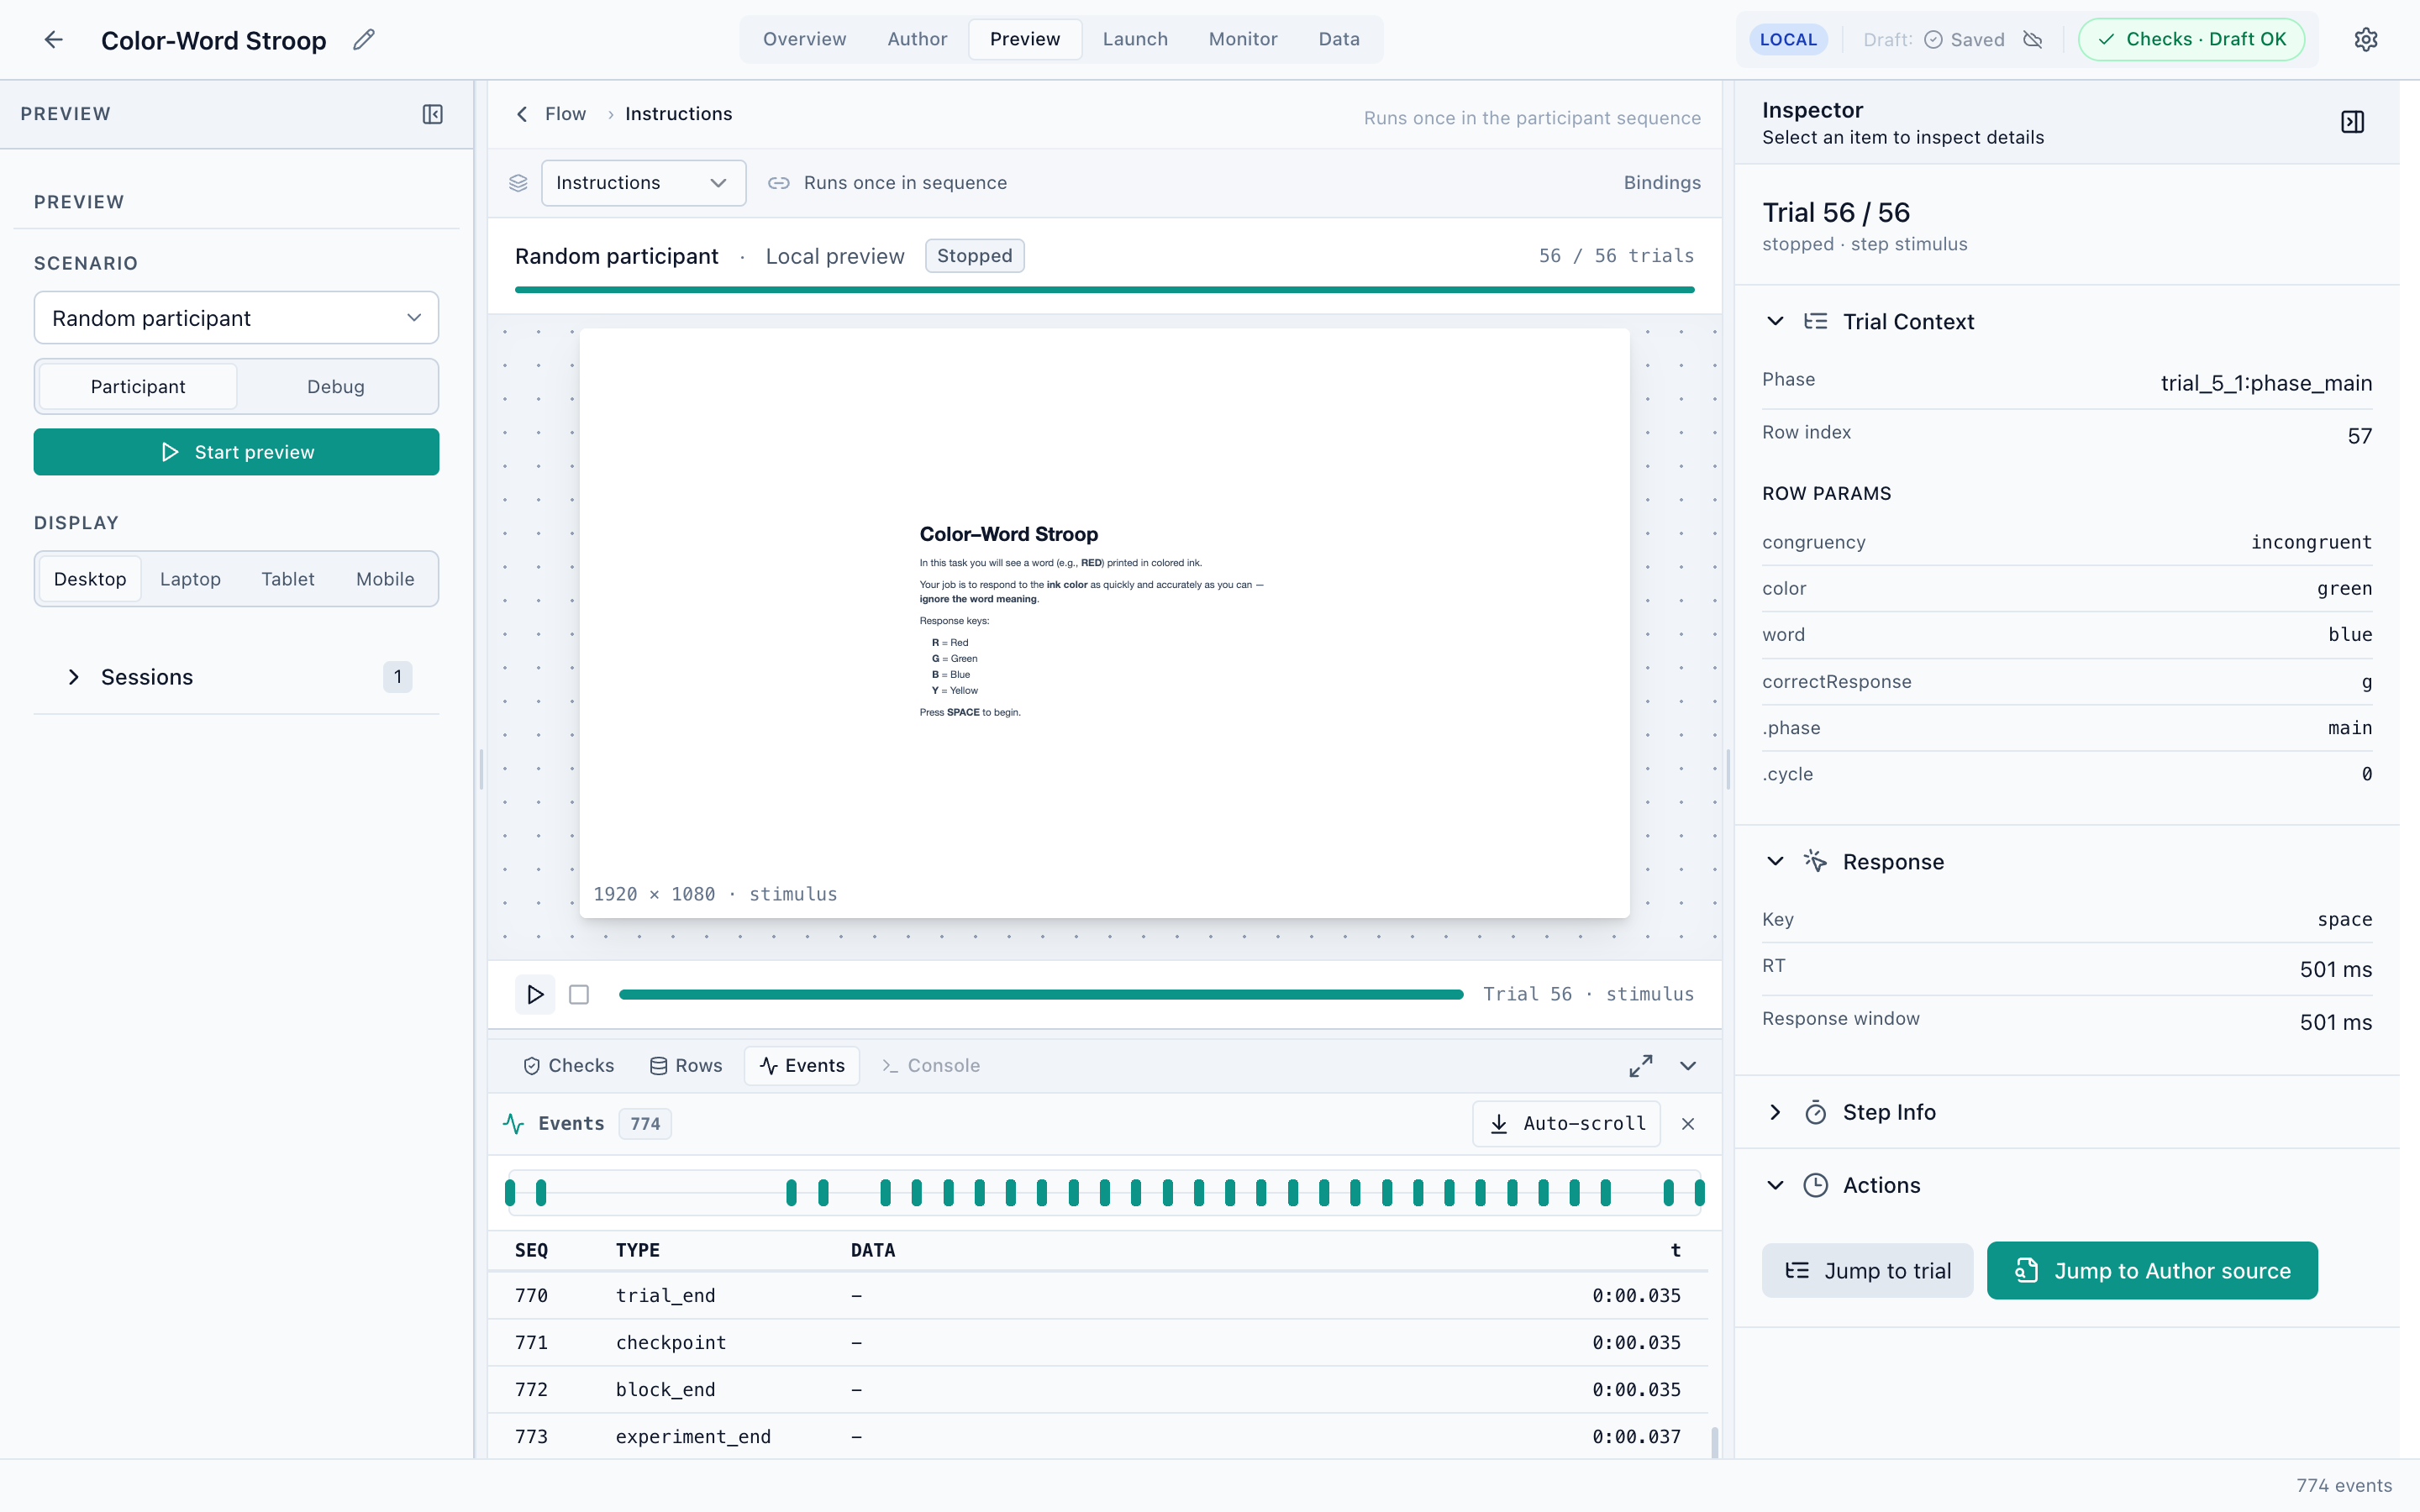
What the Inspector tells you
For the selected trial, Trial Context shows the resolved values — the actual data after
bindings are evaluated, not the binding expressions. In the screenshot, trial 56 resolved to
congruency = incongruent, color = green, word = blue, correctResponse = g, with a response
of space at RT = 565 ms. This is the single most useful view for answering “why did this trial
do that?”
The Jump to trial and Jump to Author source actions take you from a runtime event straight back to the design that produced it.
When a trial misbehaves: run a Perfect responder preview, select the offending trial in the Events dock, read its resolved Trial Context, then Jump to Author source to fix the binding or expression in Trial Design or Screen.
Sessions are local
Preview runs produce local sessions — they live in your browser, are visible here and in the local view of Monitor, and never touch a server. They're for debugging, not data collection. To gather real participant data you publish and host a run from Launch.
Next
Validate, publish a version, host a run, and recruit participants.